Victoria can see the investment, the planned megawatts and the company’s state-level financial result. A resident still cannot see a standard public account of what a single large data-centre campus uses, contributes and leaves in its host community.
The finding
Victoria is developing the capacity to attract and approve very large data centres faster than it is developing the public capacity to measure them after approval.
The missing instrument is a standard, site-by-site operating account: actual electricity and water use; contribution to the grid and water system; environmental change around the boundary; permanent local jobs and supplier contracts after construction; public infrastructure required; and where the resulting economic value goes.
The available record contains detailed financial measures for investors but no comparable public accounting model for host communities. That distinction matters in Melbourne’s west, where large digital infrastructure is clustering inside a region already used as Melbourne’s factory floor, freight corridor, sanitation zone and growth release valve.[1]
We can estimate how NEXTDC divides A$100 of Victorian revenue. We cannot tell how much of that A$100 stays near each facility.
A necessary industry — and a physical one
Data centres support hospitals, banking, emergency services, government systems, cloud computing and artificial-intelligence workloads. They are critical infrastructure. They also occupy land, reserve grid capacity, reject heat, use water and require emergency planning.
That makes the central question neither “data centres: yes or no?” nor “does the east have them too?”. The question is whether the public can compare the real operating burden and return of each large campus — and whether a region hosting a growing concentration receives a measurable share of the value.
Profit is the wrong first number
NEXTDC reported a group net loss of A$39.4 million for the six months to 31 December 2025 and capital expenditure of A$1.285 billion during the period.[4] That can sound like there is no value to trace.
But a company can record an accounting loss while operating facilities generate earnings and the company invests heavily in new capacity. Net profit can be reduced by depreciation, finance costs, central expenses and the timing of expansion. A host-community account should therefore not depend on net profit alone. The useful starting denominator is site revenue, supported by cash flow, asset value and ownership disclosures.
What NEXTDC’s Victorian accounts show
NEXTDC’s 1H26 segment note provides a view of its Victorian portfolio — M1, M2 and M3 combined. For the six months to 31 December 2025, that segment reported A$80.872 million in revenue and A$60.882 million in segment EBITDA.[5]
For every A$100 of Victorian segment revenue, the published accounts allocate approximately:
- A$13.19 to power;
- A$8.34 to facility costs;
- A$3.01 to facility employee benefits;
- A$0.18 to other direct and site expenses; and
- A$75.28 to segment EBITDA.
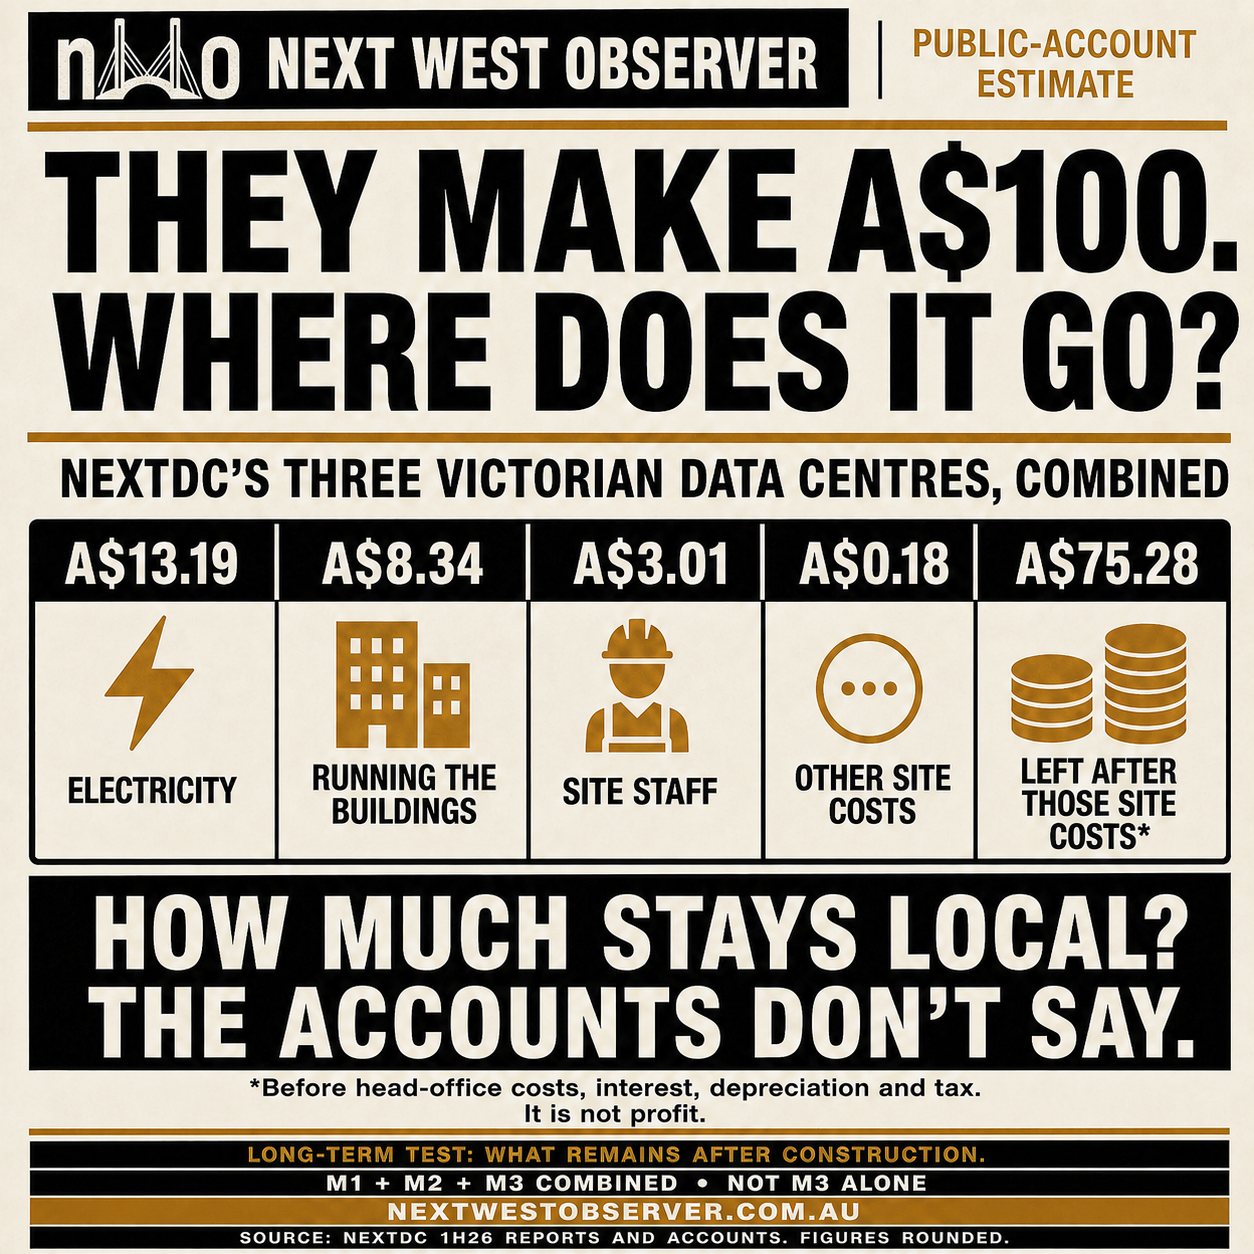
The A$75.28 is not net profit and not a dividend. Segment EBITDA is measured before company-level employee costs, central overhead, depreciation and amortisation, finance costs and tax. Across the group, NEXTDC recorded A$123.8 million in depreciation and amortisation and A$33.3 million in finance costs during the half.[5]
About A$11.53 of each A$100 appears in facility employee and non-power operating categories that could include expenditure around host communities. That is only an upper envelope. It is not a verified local-spend figure. NEXTDC does not publicly disclose how much of those categories was paid to nearby workers, local suppliers, the host council or community programs.
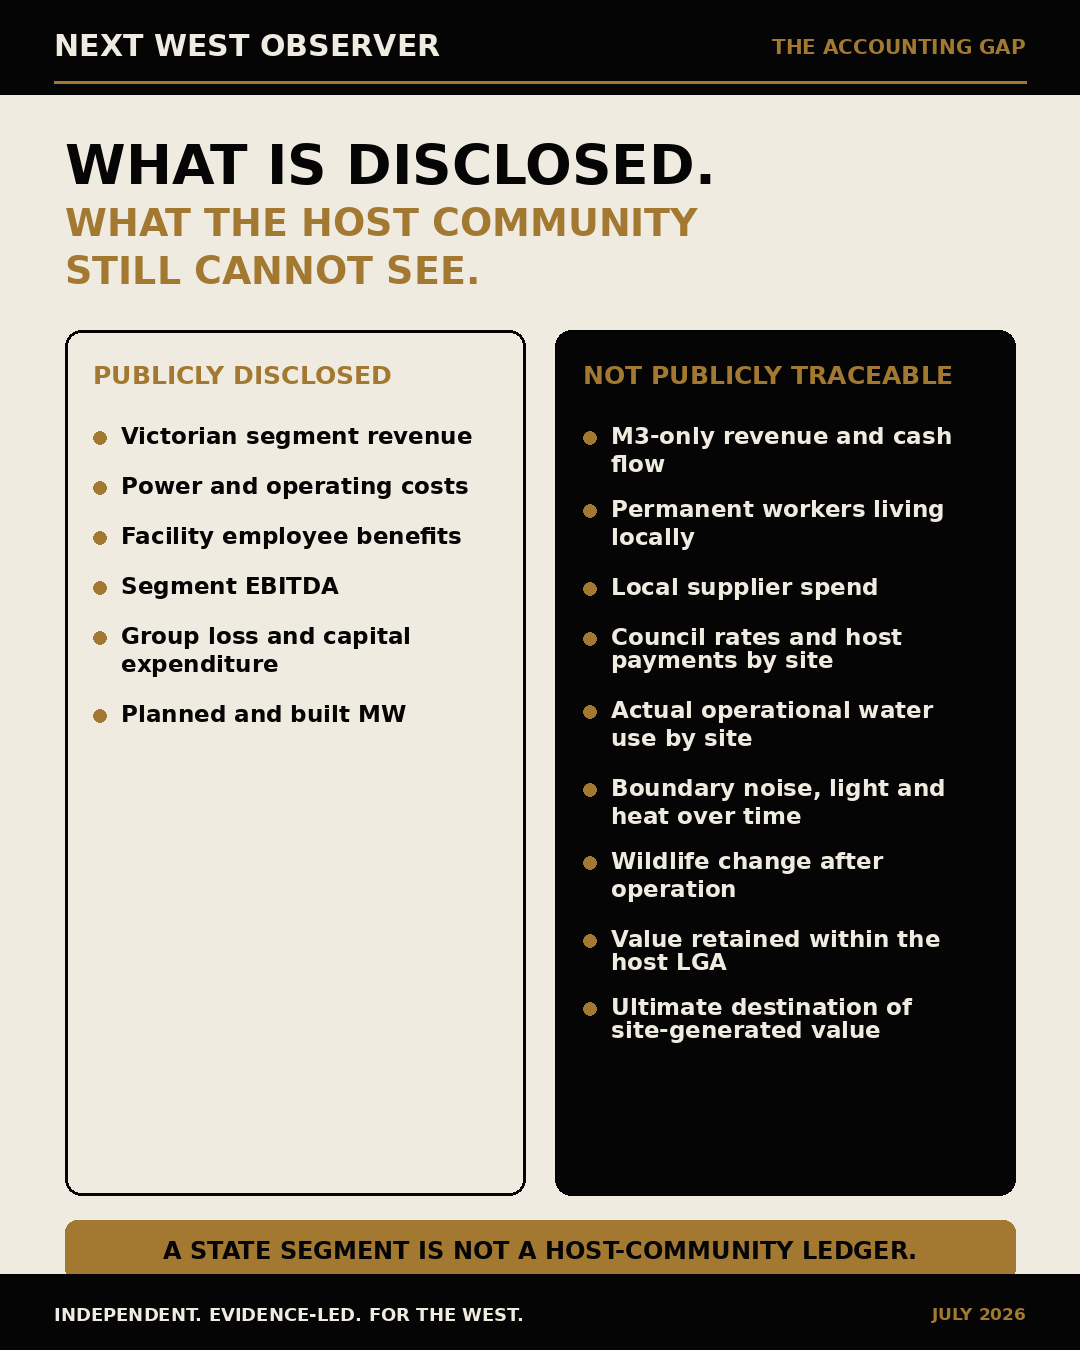
A state segment is not a West Footscray ledger
NEXTDC reported 514 MW of total planned Victorian IT power, 106 MW built and 216 MW in progress at the end of the half. M3 at West Footscray was listed at 225 MW planned capacity, with 40 MW built and 185 MW in progress.[6] NEXTDC’s M3 page describes more than 41,000 square metres of technical space and 225 MW of IT capacity.[7]
The public reporting does not provide M3-only revenue, M3-only cash flow, M3 payroll, workers’ residential locations, local procurement, council rates, community contributions or actual operational water and electricity consumption. It therefore does not show what portion of the Victorian facility result stays in Maribyrnong.
This is not an allegation that NEXTDC has breached its financial-reporting duties. Listed-company accounts are designed principally for investors. The policy gap is that governments facilitate and approve infrastructure without requiring a second ledger designed for the places that host it.
Victoria has an investment framework, not yet an operating ledger
Victoria’s Sustainable Data Centre Action Plan calls data centres critical infrastructure and describes a project pipeline worth more than A$25 billion. It coordinates work across land, energy, water, transport and workforce development, while describing itself as “primarily an internal coordination framework”.[8]
The public plan does not provide a campus-by-campus operating register, a cumulative capacity limit for western Melbourne, a standard local-value calculation or an annual forecast-versus-actual account.
The Commonwealth’s March 2026 expectations call for new clean generation or storage, payment of infrastructure costs, demand flexibility, efficient water use, transparent water reporting, Australian jobs and investment in local capability.[9] On 15 July, the Prime Minister announced proposed mandatory standards for large data centres, including obligations to underwrite new power supply, pay their full share of connection costs, reduce load when needed and be as water efficient as possible. The government said the standards were expected to be legislated in early 2027.[10]
AEMO reported that, at the end of March 2026, 11 large projects representing 5.4 GW of maximum demand were moving through the transmission-connection process, with about 40 per cent of that capacity in Victoria.[20]
Those reforms matter. They still leave a design question: who measures actual site performance over time, who publishes it, and how does a host community receive an automatic return when measured burdens rise?
Approval is not an operating audit
Many large Victorian projects qualify for the Development Facilitation Program through Clause 53.22, with the Minister for Planning as responsible authority. The clause allows the authority to waive or vary application requirements considered irrelevant and exempts decisions from third-party review rights. DFP guidance confirms that ministerial decisions under the pathway cannot be appealed to VCAT.[11][12]
Fast approval is not necessarily poor approval. But a faster and more final process raises the disclosure burden. A planning model, acoustic report or sustainability plan predicts performance before operation. It does not substitute for certified measurements after a campus is energised.
The current applications illustrate inconsistent public records. The 250 MVA proposal at 413 Francis Street, Brooklyn, lists reports on sustainability, air quality, servicing, acoustics, hazards, traffic, stormwater and trees. The 250 MVA proposal at Cherry Lane, Laverton North, currently lists no supporting documents on its register page.[13][14] A resident cannot assume the same ecological, water or community-value parameters were tested in the same way.
The ecological blind spot
Some projects undertake native-vegetation or ecology work where the site or planning controls trigger it. That is different from a standard data-centre wildlife regime.
Maribyrnong Council’s objection to the proposed M3 expansion focused on the scale of buildings beside Stony Creek, overshadowing and effects on the creek corridor and people who use it.[15] Yet there is no publicly standardised requirement for every large campus to publish seasonal baseline and post-operation results for birds, bats, frogs, aquatic life, habitat condition, light spill, low-frequency noise, water temperature and water quality.
The timeline that matters: after construction
Construction expenditure and construction jobs matter, but they are temporary. M3 still had 185 MW in progress at 31 December 2025, so the reported period includes a major build phase.[4]
The durable public test begins when the cranes and large construction workforce leave. It asks how many permanent local jobs remain, how much recurring procurement stays nearby, what the site actually consumes each year and what verified public return continues for the life of the facility.
Construction announcements should therefore be reported separately from the post-construction operating ledger. Combining them can make a short peak look like a permanent community benefit.
Who captures the value
Ownership structures differ. The following CDC example is separate from NEXTDC and is not part of the A$100 calculation above.
CDC is owned by Infratil, the Future Fund, Commonwealth Superannuation Corporation and CDC management. Infratil reported holdings of 49.75 per cent, 34.55 per cent, 12.04 per cent and 3.66 per cent respectively after a 2025 transaction.[16]
On 30 June 2026, Infratil reported that CDC’s independent equity valuation had risen to a midpoint of A$18.5 billion and valued Infratil’s 49.72 per cent interest at A$9.213 billion.[17] CSC had previously said its partial sale locked in investment returns of almost 43 per cent a year since inception, before investment-management fees, while retaining 12.04 per cent.[18]
That CSC result is an investor return from a separate operator. It is not operating revenue, not part of NEXTDC’s Victorian segment and not proof of a return to Brooklyn, Laverton North or West Footscray. A return to superannuation customers and a payment or benefit received by a host community are different flows and must be reported separately.
The ratio the public needs
Every large campus should publish a Community Footprint Statement using identical definitions. It should report actual electricity and water use, reserved and operational capacity, land occupied, permanent employment, local procurement, public payments, environmental change and ultimate value flows.
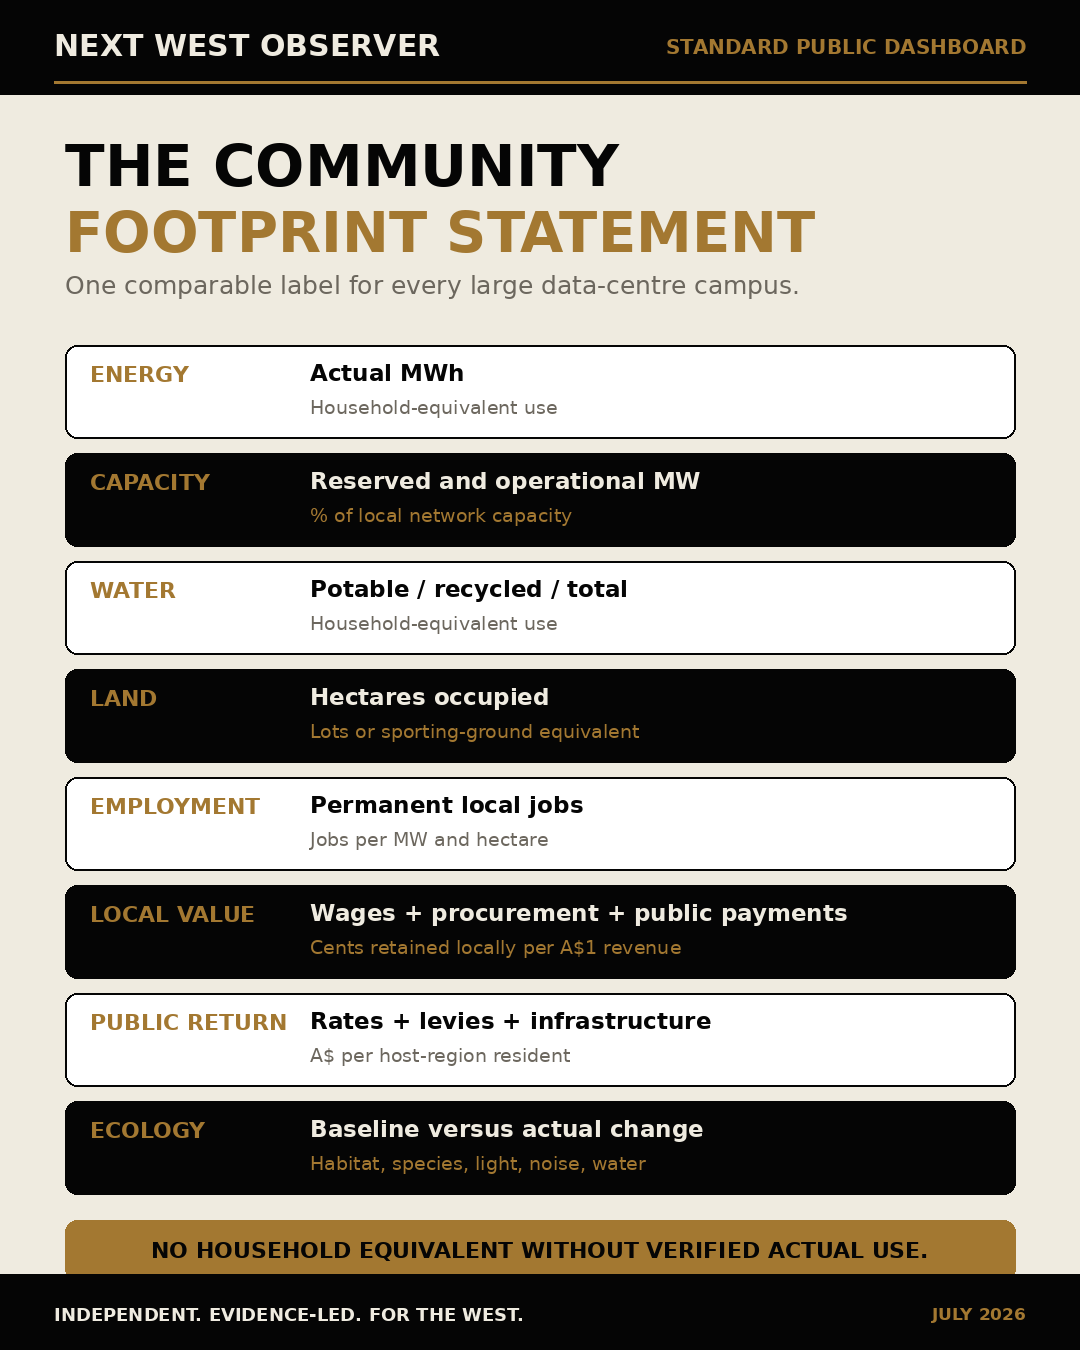
The figures should then be translated into comparable ratios:
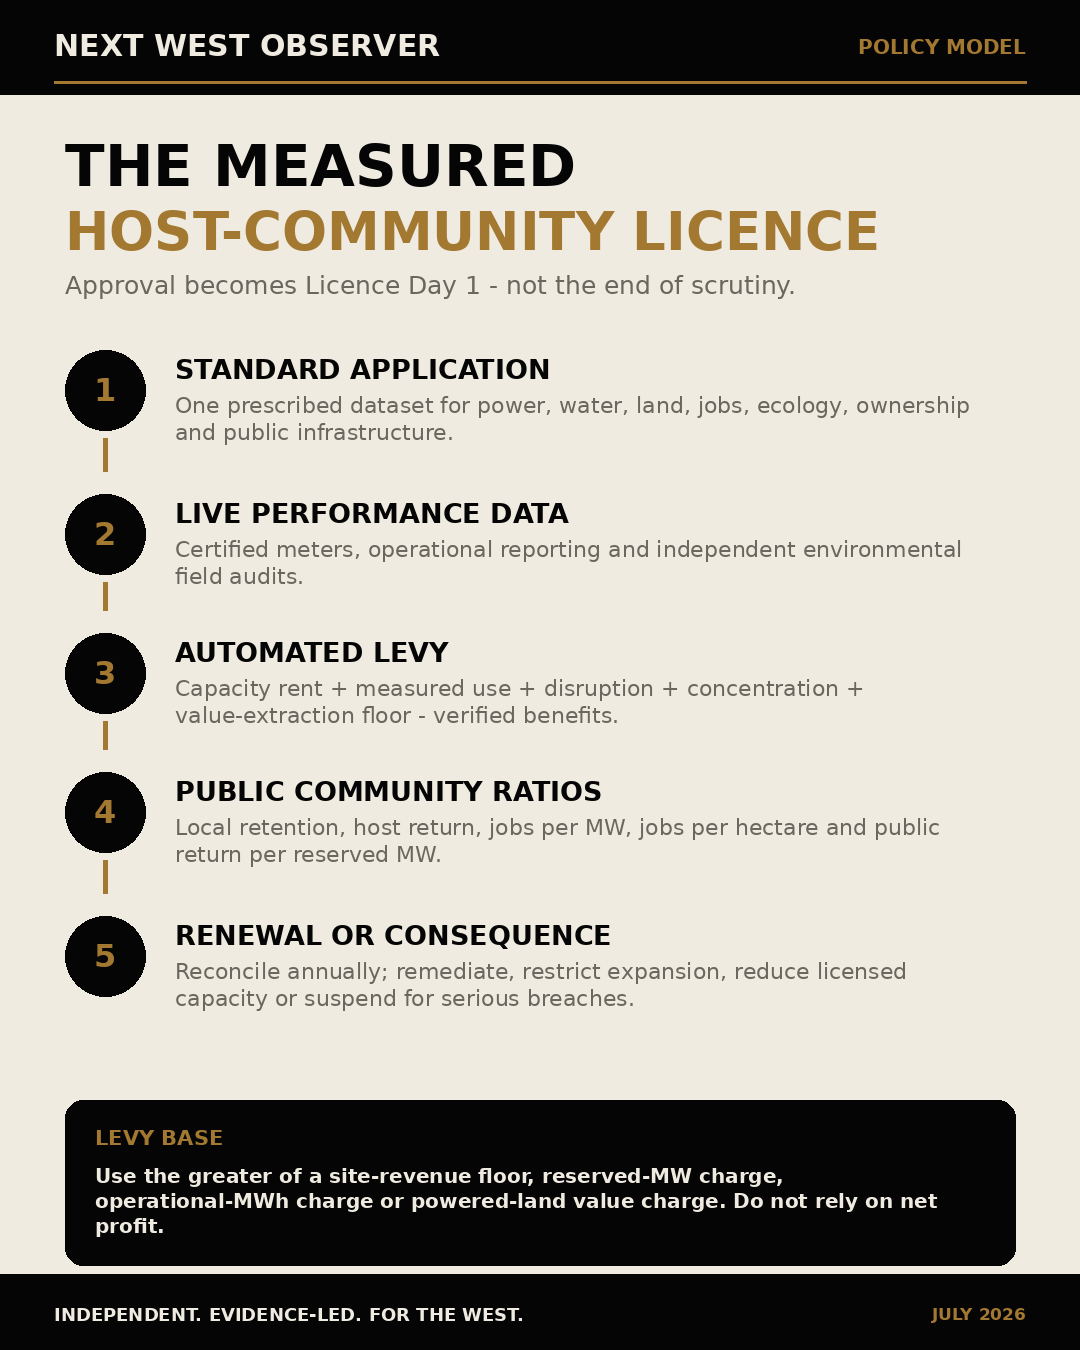
- Local Retention Ratio: local wages, local procurement and local public payments divided by site revenue.
- Host-Community Return Ratio: rates, levies, infrastructure contributions and verified local benefits divided by site revenue.
- Employment Intensity: permanent local jobs per operational MW.
- Land Productivity: permanent jobs and retained local value per hectare.
- Public Capacity Return: public payments and verified benefits per reserved MW.
- Infrastructure Recovery Ratio: operator contributions divided by attributable enabling-infrastructure cost.
Household-equivalent comparisons should be published only from verified actual consumption, not nameplate or ultimate capacity. A 225 MW campus figure is not an annual household-energy figure. Reserved capacity, built capacity, operational load and actual megawatt-hours are different measures.
A Measured Host-Community Licence
The stronger reform is not a standalone tax. It is an operating licence that begins when planning approval is granted and continues until the site is restored or transferred.
For future hyperscale precincts, the state should consider retaining or acquiring strategic land and granting long leases rather than permanently selling the underlying freehold. Victoria’s Port of Melbourne transaction offers a structural precedent: commercial operations were leased for 50 years while the state retained specified regulatory and public responsibilities.[19] Data centres are not ports, but the principle is transferable.
Annual charge = base public-capacity rent + reserved-MW charge + measured resource use + measured disruption + cumulative-concentration multiplier + value-extraction floor − verified public-benefit credits.
The value-extraction floor should not use net profit alone. It should use the greatest of a percentage of site revenue, a charge per reserved MW, a charge per operational MWh, or a percentage of powered-land or lease value. That prevents rapid expansion, depreciation, debt and internal charges from reducing the community return to zero.
What must be standardised
A workable system needs prescribed units, attribution rules, calibrated rates, independent auditors, appeal rights and protection against double charging. It should include:
- one statutory application dataset covering power, water, land, transport, emergency services, ecology, jobs, ownership and public infrastructure;
- revenue-grade meters and regulator-controlled reporting for electricity, water, generator operation, heat discharge, boundary noise and light;
- independent seasonal ecology surveys against the pre-construction baseline;
- a site-level Value Retention Ledger showing the destination of every A$100 of revenue: wages, suppliers, utilities, finance, related-party fees, tax, reinvestment and distributions;
- a cumulative precinct audit so the fifth facility is not assessed as though the first four do not exist; and
- annual reconciliation, public dashboards, penalties for missing or false data, remediation orders and capacity restrictions for serious non-compliance.
The questions now owed
- What site-level operational data is collected now, by whom, and how much is public?
- What is the cumulative approved, built, connected and operational data-centre capacity in each Victorian region?
- How many permanent local jobs and how much local procurement remain at each campus after construction?
- What public infrastructure costs are attributable to each project, and what proportion is recovered from the operator?
- Which existing and pending projects will be covered by the proposed federal power and water standards?
- What standard wildlife and waterway monitoring is required before and after operation?
- What threshold would cause the state to pause further concentration in one grid zone, catchment or host community?
Construction ends. The operating footprint does not. If Victoria can approve the capacity, why can’t it publish the return?
Method and limitations
This analysis distinguishes group profit, state-segment EBITDA and site-level community value. It does not treat EBITDA as distributable profit and does not claim that facility operating categories are local spending. The NEXTDC estimate covers the combined Victorian segment, not M3 alone.
MW, MVA, built capacity, contracted capacity, operational demand and annual electricity consumption are different measures. They are not added together or converted into household equivalents without verified load and time data.
The policy model is an editorial proposal based on the documented gaps. It is not presented as existing Victorian law.
NEXTDC, the Victorian Government, the Commonwealth, relevant councils and utilities are invited to respond to the factual findings and public-data questions in this article. Substantive responses will be added with a dated update.